A new feature has been added in numerous places in BBS where users can now view list box data in a chart.
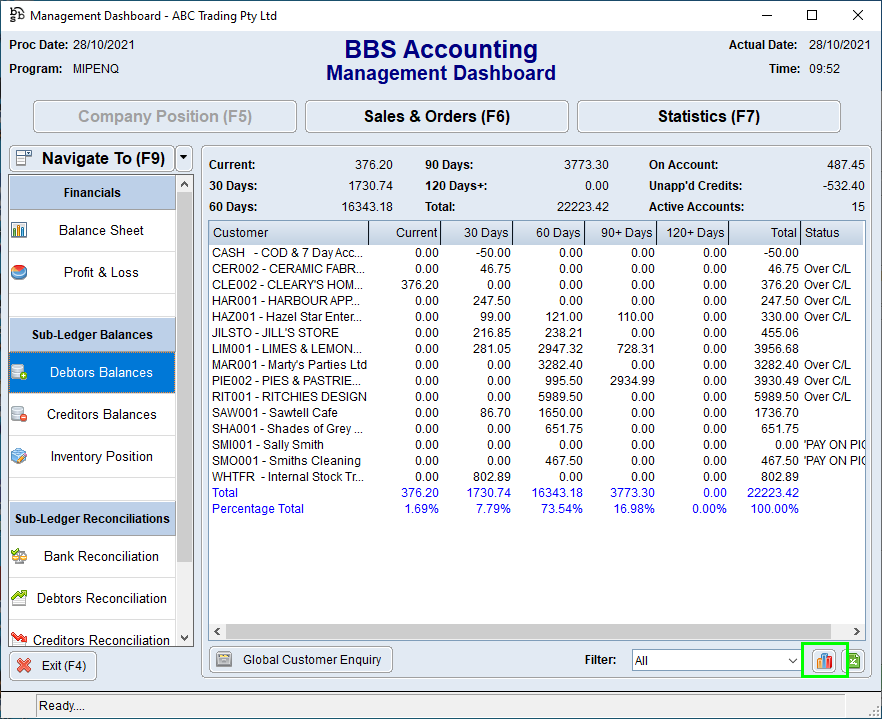
Clicking on the  button in a screen will allow users to display the data in the list box in chart form.

Example of data in a column chart
Please note:
1.Charts will only be based on the data that is in the list box – this may mean users will need to use the More button to ensure the list is fully populated prior to charting the data or the chart data may be incomplete.
2.Users can select a chart type, the chart perspective/grouping, and deselect the data sets they do not want to see.
3.By default, charts will show the first 30 data points sorted from largest to smallest value – this can be changed using the Max Points options.
4.Pie charts should only be used to compare two data sets to see the percentage of one compared to the other (ie product group sales for a month), that are of the same type (selecting to compare a quantity data set and a dollar value data set will result in meaningless values).
Please refer to BBS Accounting Basic - Charts for more information.