|
Reports Menu > Sales Analysis > Customer Sales Reports > Customer Buying Patterns Report |
The Customer Buying Patterns Report displays sales data and buying patterns for customers based on sales history and ordering patterns using a selection of parameters.

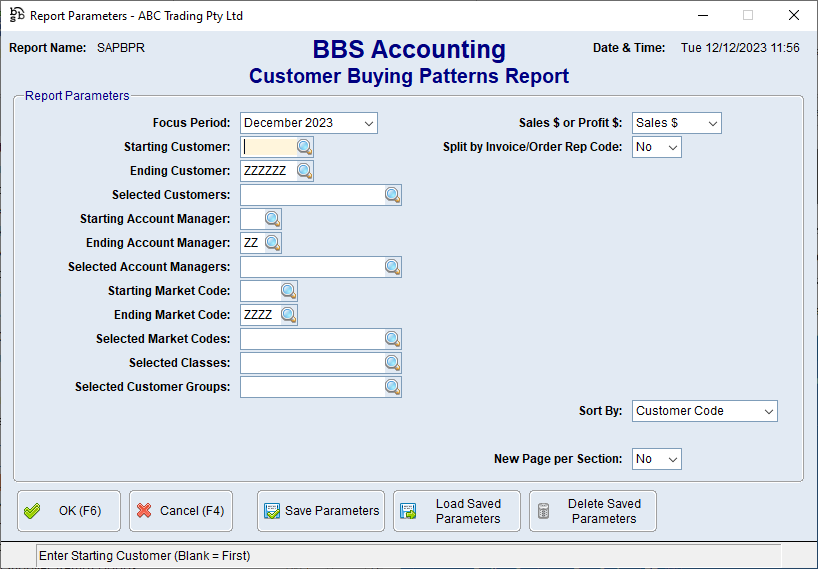
Customer Buying Pattern Report Screen
Parameter Name |
Description |
Focus Period |
The Focus Period chosen will show buying patterns for the period chosen and the 12 months prior. Clicking the drop down arrow allows users to select a different period. |
Starting Customer Ending Customer Selected Customers Starting Account Manager Ending Account Manager Selected Account Managers Starting Market Code Ending Market Code Selected Market Codes Selected Classes Selected Customer Groups |
Parameters to restrict the customers you wish to generate the report for. |
Sales $ or Profit $ |
Sales $ - The report will display showing figures based on Sales values Profit $ - The report will display showing figures based on Profit value |
Split by Invoice/Order Rep Code |
Yes - The report will display each customer split by the sales rep recorded on Invoice/Order (therefore a customer may appear on the report more than once) No - The report will display all the figures for a customer against the customer rep code |
Sort By |
Customer Code - The report will sort and display by Customer Code Rep Code (Customer) - The report will sort and display by Customer Rep Code Market Code - The report will sort and display by Market Code Customer Group - The report will sort and display by Customer Group |
New Page per Section |
Yes - When printed the report will print on separate pages when sorted by any of the Sort By parameters excluding Customer Code |
When the required parameters have been entered, the Customer Buying Patterns Report will be generated. (Due to the width of the Customer Buying Patterns Report the below example has been separated into two parts).


Customer Buying Patterns Report
Column |
Description |
Month / Year Columns |
Displays the sales/profit value for the customer (or customer/sales rep) for the month |
12 Mth Avg |
Average sales/profit value of the 12 months prior to the focus period chosen |
13 Mth Total |
Total sales/profit value of the focus period chosen and the 12 months prior |
T/Mth vs Avg$ |
Sales/profit for the focus period vs the average of the 12 months prior to the focus period |
# OSO |
Number of outstanding sales orders |
OSO Value |
Dollar value of outstanding sales orders |
% Web Orders |
Percentage of sales orders that have web order numbers (orders were placed on the web) |
% Manual Orders |
Percentage of sales orders that do not have web order numbers (orders were not placed on the web) |
Avg Ords p/mth |
Average number of orders per month, based on the 12 months prior to the focus period |
Avg Ord Value |
Average order value, based on the 12 months prior to the focus period |
Order Freq (Days) |
Average order frequency is calculated using the number of orders placed in the 12 months prior to the focus period |
Days Since Last Ord |
Number of days since last order |
Ord Freq vs Last Order |
The difference between the number of days since the last order was placed and the average order frequency |
Growth 3Mths |
Growth in sales/profit dollars for the last 3 months (excluding the current month, compared against the 3 months prior |
Growth 6Mths |
Growth in sales/profit dollars for the last 6 months (excluding the current month, compared against the 6 months prior |
Growth 12Mths |
Growth in sales/profit dollars for the last 12 months (excluding the current month, compared against the 12 months prior |
